5. Wind conditions 5.2 Cold air flow
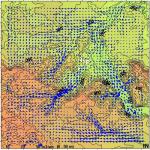
As a consequence of the shielding effect of the surrounding mountain ranges, local wind systems, that are often formed at slopes and in valleys, are very much in evidence. Even if they have no high wind speeds, they play a significant role for the local aeration of Stuttgart's city districts. Figure 5-3 depicts model calculations (SCHÃDLER, 1996) of the wind speeds in Stuttgart resulting from the cold-air flow (at a layer height of 0-50 m). The highest speeds of cold air can be measured at steeper slopes as well as in the Nesenbach valley and Rohracker valley. Maximum speed can reach up to 3 m/s.
 | |
|
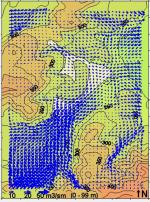
Fig. 5-4: Cold-air flows in Stuttgart, current state as volume flow density (m³/ms)
(average layer height of 0-50 m)
| |
What is more decisive than the speed of cold-air flows is, however, the amount of cold air. This is why figures 5-4 (the whole of Stuttgart) and 5-5 (inner city and the plan area) picture the volume flow density of the cold air. The volume flow density of the cold air is in our case the amount of cold air (in m³) that flows through a band (one meter wide) between the earth's surface and 50 m above ground (vertical to the flow) in one second. The unit is m³/ms or m²/s.
The results of the cold-air flow calculation only consider those parameters that are relevant for the formation, discharge and balancing of cold-air flows. What is not taken into account is the mingling with dynamic wind field components, i.e. modifications of the large-scale wind conditions due to topographic conditions. This is why we will present the dynamic wind field components in the following chapter and then mingle them with the cold-air flows in order to gain statistic distributions of the wind directions (wind roses).
Infrared thermography, which we treated in chapter 4, is based on measurements and analyses which were made during a weather situation with little supraregional wind. This is why the thermal pictures of the city represent a thermal situation that corresponds to the starting point of cold-air flow calculations. We therefore recommend to consider both analyses in combination.
|  |
|
|
Fig. 5-5: Cold-air flows in Stuttgart's inner city (including the plan area), current state as volume flow density (m³/ms)
(average layer height of 0-50 m)
|
The air supply across vegetation areas in Stuttgart's west is very difficult as there are only few extended catchment areas that can supply fresh air. It is mainly the Vogelsang valley, starting at Birkenkopf and Hasenberg, which contributes to the aeration of the west basin. Green and open spaces in this area facilitate the flowing of air near the ground. In contrast to the west basin, the Nesenbach valley has better means of aeration, e.g. through the valley's accessibility for prevailing wind flows, the development of the valley bottom into a broad transport route and the existence of the castle gardens at the end of the valley. The circumstances for a local air exchange beyond the slopes are advantageous due to larger and cohesive green spaces in the inner city's South and Southeast. The often gorge-like slopes and clefts facilitate the flowing of cold air towards the inner city.
Figure 5-5 illustrates that the following areas with cold-air flows are important for the planning of Stuttgart 21:
1) Wartberg-Klinge/Steinberg-Klinge
2) Eckardshalde
3) Mönchhalde
As shown in the model calculations, the flows on the slope side only occur near the ground and reach up to an altitude of about 15 m as downhill winds.
In connection with the Nesenbächer wind, cold air also flows in massively between Uhlandshöhe and Kriegsberg where the valley narrows to the lower castle gardens. A reverse flow from the Northeast emanates from Rosensteinpark and the Neckar valley. These flows are much more powerful than the cold-air flows above the slopes and small gorges of the basin border and they can reach an altitude of more than 50 m. They are of great importance for the air hygiene and air exchange of the city basin, whereas the cold-air flows near the ground have local effects in terms of air hygiene and bioclimate.

| |

|
 |
|
| © City of Stuttgart, Office for Environmental Protection, Section of Urban Climatology |